|
|

| Troubleshooting | News | Technical | Search |
| Home | Forum 56 | Premium | Site Map |
 |
|
||||||||
 |
|
||||||||
| Home • Troubleshooting • Trouble Beyond the Modem • Understanding Traces | |||||||||
Understanding Traces
If you learn how to effectively use and understand the results of a trace tool, you'll know more about what's wrong or right with your connection, your ISP, and the network beyond.
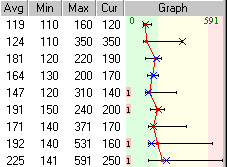
Below is a Ping Plotter display of a dial-up connection tracing to the ISP's local server:
First, look at the latency:
| The latency for each hop (router) is displayed.
The graph indicates the scale (0 - 591ms in this case), and depicts the minimum,
maximum, current (X) and average (the vertical line) latency, and an indication
of packet loss.
You want to see consistently low latency and no packet loss. (The trace data to the right is far from ideal!) |
 |
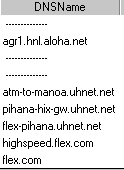
With dial-up connections, the lowest latency you can expect to your first hop (your ISP's Remote Access Server) is around 100ms. (1/10th of a second). The lowest latency to any server on the Internet depends upon where your ISP is, where the server is, and the connections in between. The DNS name can provide clues:
| In this case, I am dialed into ISP Flex.com. This
is a "virtual" ISP: the access is provided by another company (GST/Aloha.net),
and the ISP's mail, news and web servers are connected to the RAS via the
University of Hawaii network HIX. In this 5-minute sample, the average
difference between the latency to the RAS (119ms) and the ISP's server (225ms) =
106ms with packet loss will impair performance of the ISP's mail, news and
webpage services.
An ISP that provides and operates its own access facilities and servers can have a performance advantage. |
 |
The problem to your local servers doesn't necessarily extend to other sites:
Consider the following trace:
In this case, the average latency to the server - 236ms - is only 9ms more than to the local server, but the server is over 2000 miles further away! The RAS shows a spike to 381ms, and routers along the way have large sample variations, but the server being reached has a smaller range of latency samples, the highest being less than the maximum latency to earlier routers! This is also reflected in the bottom graph which shows relatively little variance in latency to the destination.The DNS names above show hop 4 to be a SFO-HNL link (Honolulu, Hawaii to San Francisco, California) - notice the average latency increases by 110ms at this hop. A portion of this latency (about 40ms) is unavoidable due to distance and the speed of light. From the SFO landing, the data is routed to the server in San Jose (SJC) on a different network. Note that errors (packet loss) are reported starting at hop 2 - the ISP's RAS. Longer-term monitoring in this case is needed to evaluate where the problem is: because each ping to each router comes at a different instant in time, the latency or loss indicated at higher hops can actually be caused by lower numbered hops. This can cause confusion among users and ISP support departments in determining where a problem is and who is responsible to fix it.
Continued -> Next Page.
| Home | Links | Send
Feedback | Privacy Policy | Report Broken Link Legal Page | Author's Web Sites | Log In |
|
Modemsite.com ©1998-2022 v.Richard Gamberg. All rights reserved. |